Characteristic |
Non-Hispanic White adults |
Non-Hispanic Black adults |
Hispanic adults |
p-value 2 |
Overall |
|---|---|---|---|---|---|
| Age, mean (standard error) | 57 (49 – 61) | 52 (46 – 58) | 52 (44 – 60) | 0.026 | 55 (47 – 60) |
| Age groups, n (weighted %) | 0.68 | ||||
| 20-39 | 17 (11%) | 14 (11%) | 4 (7.0%) | 35 (11%) | |
| 40-64 | 156 (89%) | 168 (89%) | 95 (93%) | 419 (89%) | |
| Sex, n (weighted %) | 0.22 | ||||
| Men | 104 (57%) | 92 (47%) | 54 (55%) | 250 (54%) | |
| Women | 69 (43%) | 90 (53%) | 45 (45%) | 204 (46%) | |
| Education level, n (weighted %) | <0.001 | ||||
| Less than 9th grade | 15 (6.9%) | 7 (4.3%) | 30 (30%) | 52 (9.2%) | |
| 9-11th grade (Includes 12th grade with no diploma) | 42 (18%) | 41 (22%) | 24 (22%) | 107 (20%) | |
| High school graduate/GED or equivalent | 48 (30%) | 55 (31%) | 19 (25%) | 122 (29%) | |
| Some college or AA degree | 52 (34%) | 62 (34%) | 22 (18%) | 136 (32%) | |
| College graduate or above | 16 (11%) | 17 (8.6%) | 4 (5.3%) | 37 (9.7%) | |
| Insurance, n (weighted %) | 155 (89%) | 152 (81%) | 80 (81%) | 0.17 | 387 (86%) |
| Private, n (weighted %) | 54 (100%) | 44 (100%) | 18 (92%) | 0.039 | 116 (99%) |
| Medicare, n (weighted %) | |||||
| Yes | 53 (100%) | 59 (100%) | 25 (100%) | 137 (100%) | |
| Medicaid, n (weighted %) | |||||
| Yes | 57 (100%) | 64 (100%) | 29 (100%) | 150 (100%) | |
| BMI, n (weighted %) | 0.33 | ||||
| <18.5 | 3 (1.2%) | 2 (1.5%) | 1 (1.3%) | 6 (1.3%) | |
| 18.5–24.9 | 20 (11%) | 28 (18%) | 5 (7.4%) | 53 (13%) | |
| 25–29.9 | 36 (20%) | 27 (17%) | 29 (30%) | 92 (20%) | |
| ⩾30.0 | 100 (67%) | 109 (63%) | 53 (61%) | 262 (66%) | |
| Waist circumference, n (weighted %) | 0.59 | ||||
| Normal | 34 (21%) | 35 (27%) | 18 (24%) | 87 (23%) | |
| High | 118 (79%) | 113 (73%) | 64 (76%) | 295 (77%) | |
| Smoking status, n (weighted %) | 0.003 | ||||
| Never | 39 (28%) | 82 (47%) | 46 (51%) | 167 (36%) | |
| Past | 62 (36%) | 46 (22%) | 38 (29%) | 146 (31%) | |
| Current daily/nondaily smoker | 72 (37%) | 54 (32%) | 15 (20%) | 141 (33%) | |
| 1
Median (Q1 – Q3); n (unweighted) (%) |
|||||
| 2
Design-based KruskalWallis test; Pearson’s X^2: Rao & Scott adjustment |
|||||
Racial Disparities in Heart Failure Prevalence and Mortality: insights from the National Health and Nutrition Examination Survey
Muhammad Saad 
Preamble:
Reference Papers:
Study Objective: To examine racial and ethnic disparities in heart failure (HF) prevalence and outcomes among young to middle-aged adults in the United States.
Data Source: Cross-sectional analysis of the National Health and Nutrition Examination Survey (NHANES) from 2005 to 2018.
Population: Adults aged 20-64 years with self-reported heart failure.
Race Categories:
Non-Hispanic White (NH White)
Non-Hispanic Black (NH Black)
Hispanic
Outcomes:
Prevalence of Heart Failure
All-Cause Mortality
Cardiac Mortality
Statistical Analysis: Multiple logistic regression and Cox proportional-hazards models were used to assess the independent association of race/ethnicity with heart failure (HF) prevalence and mortality outcomes, respectively, adjusted for:
Demographics: Age, sex, race/ethnicity, insurance coverage, and waist circumference.
Medical History: Hypertension, diabetes mellitus, hyperlipidemia, cancer, stroke, coronary artery disease, chronic obstructive pulmonary disease (COPD), and arthritis.
Lifestyle Factors: Smoking status
Software: All statistical analyses were conducted using R Version 4.4.1, incorporating sampling weights, primary sampling units, and strata to ensure the accuracy and generalizability of the results.
Baseline Table:
Comorbidities Table:
Characteristic |
Non-Hispanic White adults |
Non-Hispanic Black adults |
Hispanic adults |
p-value 2 |
Overall |
|---|---|---|---|---|---|
| Hypertension, n/N (weighted %) | 127/173 (72%) | 157/182 (86%) | 81/99 (81%) | 0.033 | 365/454 (77%) |
| Mean systolic blood pressure (SE) | 122 (114 – 135) | 131 (115 – 150) | 126 (115 – 137) | 0.013 | 124 (115 – 139) |
| Mean diastolic blood pressure (SE) | 71 (64 – 80) | 77 (67 – 85) | 74 (65 – 83) | 0.010 | 73 (65 – 81) |
| Diabetes, n/N (weighted %) | 72/170 (45%) | 75/173 (39%) | 51/95 (49%) | 0.48 | 198/438 (44%) |
| Hyperlipidemia, n/N (weighted %) | 103/166 (62%) | 108/169 (63%) | 53/90 (50%) | 0.22 | 264/425 (61%) |
| Cancer, n/N (weighted %) | 29/172 (19%) | 17/182 (7.0%) | 8/98 (6.0%) | 0.002 | 54/452 (14%) |
| Stroke, n/N (weighted %) | 37/173 (19%) | 28/182 (14%) | 14/98 (11%) | 0.27 | 79/453 (17%) |
| Coronary artery disease, n/N (weighted %) | 111/173 (60%) | 92/181 (50%) | 72/98 (71%) | 0.036 | 275/452 (59%) |
| COPD, n/N (weighted %) | 70/107 (60%) | 46/96 (46%) | 29/59 (47%) | 0.24 | 145/262 (55%) |
| Arthritis, n/N (weighted %) | 100/173 (59%) | 96/182 (50%) | 49/99 (39%) | 0.022 | 245/454 (54%) |
| Obesity, n/N (weighted %) | 100/159 (67%) | 109/167 (63%) | 53/89 (61%) | 0.66 | 262/415 (65%) |
| 1
n (unweighted)/N (unweighted) (%); Median (Q1 – Q3) |
|||||
| 2
Pearson’s X^2: Rao & Scott adjustment; Design-based KruskalWallis test |
|||||
Multivariable Logistic Regression:
Prevalence of HF:
Unadjusted ORs
Characteristic |
OR (95% CI) 1 |
p-value |
|---|---|---|
| Race/Ethnicity | ||
| Non-Hispanic White adults | — | |
| Non-Hispanic Black adults | 2.31 (1.79 to 2.98) | <0.001 |
| Hispanic adults | 0.86 (0.59 to 1.26) | 0.45 |
| 1
OR = Odds Ratio, CI = Confidence Interval |
||
Adjusted ORs
Characteristic |
OR (95% CI) 1 |
p-value |
|---|---|---|
| Race/Ethnicity | ||
| Non-Hispanic White adults | — | |
| Non-Hispanic Black adults | 2.43 (1.57 to 3.78) | <0.001 |
| Hispanic adults | 1.81 (0.92 to 3.56) | 0.083 |
| Age | 1.04 (1.02 to 1.07) | <0.001 |
| Sex | ||
| Men | — | |
| Women | 0.86 (0.52 to 1.42) | 0.54 |
| Health Insurance (Yes/No) | ||
| Yes | — | |
| No | 1.12 (0.54 to 2.31) | 0.75 |
| Waist Circumference | ||
| Normal | — | |
| High | 1.06 (0.55 to 2.02) | 0.86 |
| Smoking Status | ||
| Never | — | |
| Past | 1.37 (0.72 to 2.62) | 0.34 |
| Current daily/nondaily smoker | 1.43 (0.73 to 2.79) | 0.29 |
| Hypertension | 2.20 (1.20 to 4.03) | 0.011 |
| Diabetes Mellitus | 1.90 (1.22 to 2.95) | 0.005 |
| Hyperlipidemia | 1.00 (0.63 to 1.60) | 0.99 |
| Cancer | 1.23 (0.48 to 3.16) | 0.66 |
| Stroke | 3.05 (1.60 to 5.81) | <0.001 |
| Coronary Artery Disease | 17.0 (9.72 to 29.6) | <0.001 |
| Chronic Obstructive Pulmonary Disease | 2.30 (1.35 to 3.89) | 0.002 |
| Arthritis | 0.96 (0.56 to 1.63) | 0.87 |
| Obesity | 1.80 (0.97 to 3.32) | 0.060 |
| 1
OR = Odds Ratio, CI = Confidence Interval |
||
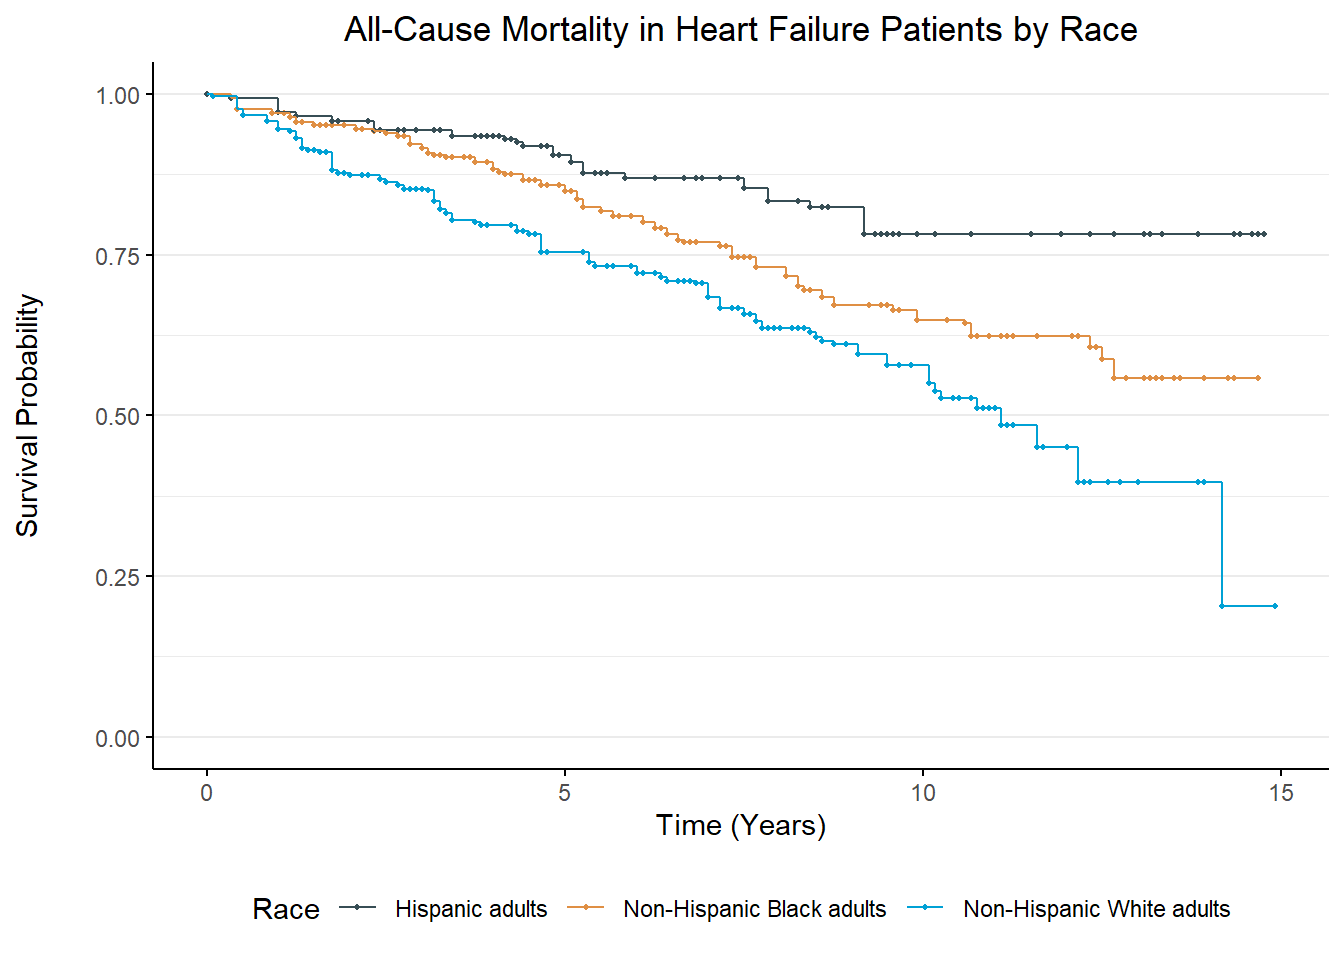
Cox Proportional Hazards Model
All-Cause Mortality
Unadjusted HRs
Stratified 1 - level Cluster Sampling design (with replacement)
With (174) clusters.
subset(dsgn, race %in% c("Non-Hispanic White adults", "Non-Hispanic Black adults",
    "Hispanic adults") & RIDAGEYR >= 20 & RIDAGEYR <= 64 & heart_failure ==
    1)
Characteristic |
HR (95% CI) 1 |
p-value |
|---|---|---|
| Race/Ethnicity | ||
| Non-Hispanic White adults | — | |
| Non-Hispanic Black adults | 0.64 (0.42 to 0.98) | 0.039 |
| Hispanic adults | 0.34 (0.17 to 0.67) | 0.002 |
| 1
HR = Hazard Ratio, CI = Confidence Interval |
||
Adjusted HRs
Stratified 1 - level Cluster Sampling design (with replacement)
With (174) clusters.
subset(dsgn, race %in% c("Non-Hispanic White adults", "Non-Hispanic Black adults",
    "Hispanic adults") & RIDAGEYR >= 20 & RIDAGEYR <= 64 & heart_failure ==
    1)
Characteristic |
HR (95% CI) 1 |
p-value |
|---|---|---|
| Race/Ethnicity | ||
| Non-Hispanic White adults | — | |
| Non-Hispanic Black adults | 0.53 (0.11 to 2.55) | 0.43 |
| Hispanic adults | 0.52 (0.19 to 1.42) | 0.20 |
| Age | 1.10 (1.03 to 1.17) | 0.005 |
| Sex | ||
| Men | — | |
| Women | 0.43 (0.15 to 1.23) | 0.11 |
| Health Insurance (Yes/No) | ||
| Yes | — | |
| No | 0.81 (0.14 to 4.69) | 0.82 |
| Waist Circumference | ||
| Normal | — | |
| High | 1.71 (0.34 to 8.66) | 0.51 |
| Smoking Status | ||
| Never | — | |
| Past | 0.76 (0.18 to 3.25) | 0.72 |
| Current daily/nondaily smoker | 1.00 (0.17 to 5.82) | >0.99 |
| Hypertension | 0.20 (0.09 to 0.46) | <0.001 |
| Diabetes Mellitus | 0.96 (0.37 to 2.48) | 0.94 |
| Hyperlipidemia | 0.58 (0.18 to 1.86) | 0.36 |
| Cancer | 2.69 (0.79 to 9.11) | 0.11 |
| Stroke | 0.55 (0.19 to 1.57) | 0.27 |
| Coronary Artery Disease | 1.39 (0.37 to 5.17) | 0.63 |
| Chronic Obstructive Pulmonary Disease | 4.23 (1.47 to 12.1) | 0.007 |
| Arthritis | 1.25 (0.22 to 6.98) | 0.80 |
| Obesity | 1.58 (0.51 to 4.92) | 0.43 |
| 1
HR = Hazard Ratio, CI = Confidence Interval |
||
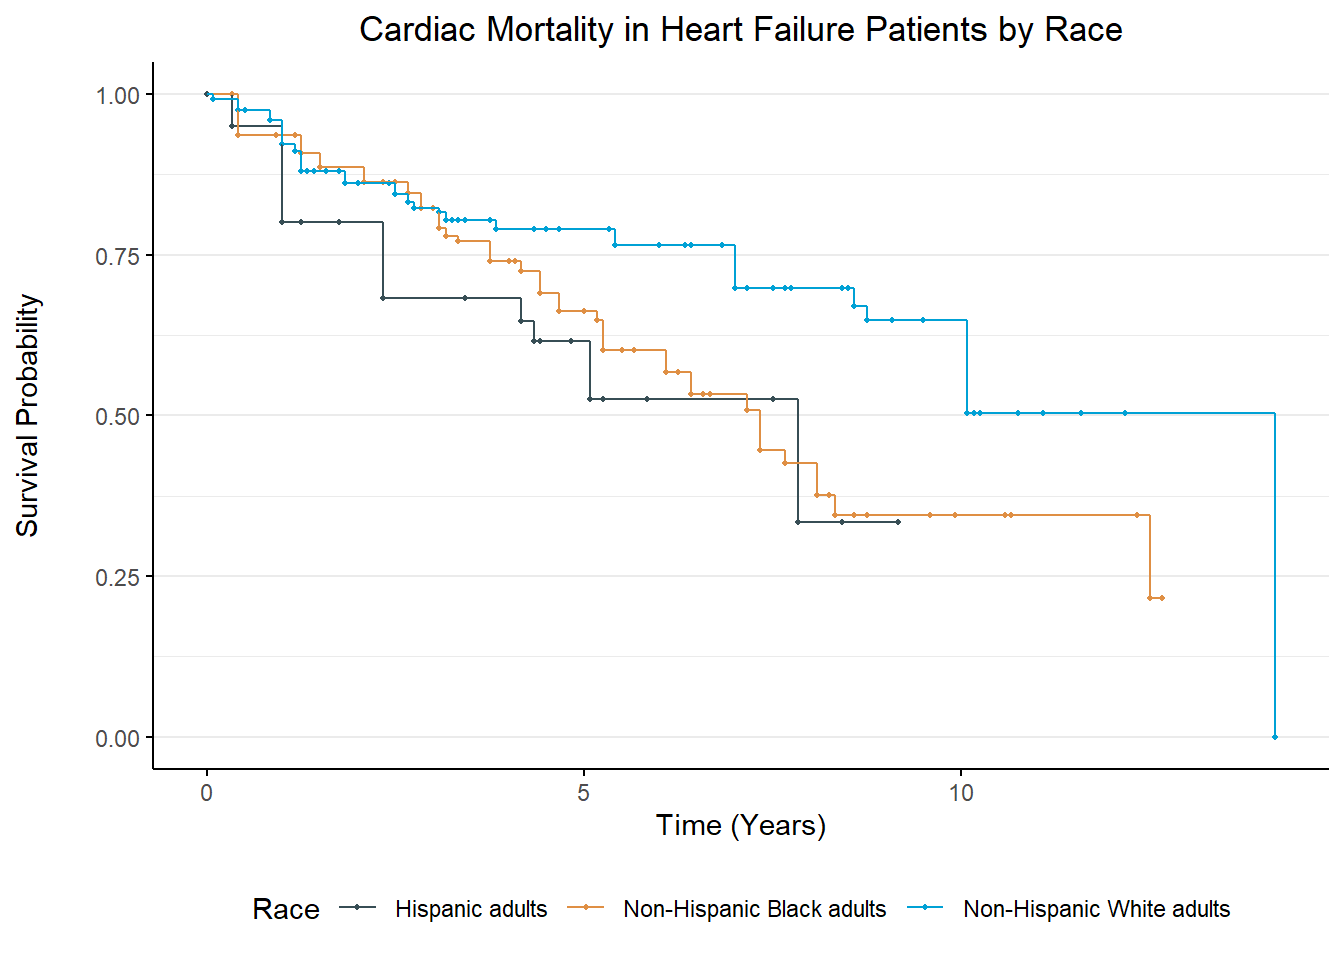
Cardiac Mortality
Unadjusted HRs
Stratified 1 - level Cluster Sampling design (with replacement)
With (174) clusters.
subset(dsgn, race %in% c("Non-Hispanic White adults", "Non-Hispanic Black adults",
    "Hispanic adults") & RIDAGEYR >= 20 & RIDAGEYR <= 64 & heart_failure ==
    1)
Characteristic |
HR (95% CI) 1 |
p-value |
|---|---|---|
| Race/Ethnicity | ||
| Non-Hispanic White adults | — | |
| Non-Hispanic Black adults | 1.82 (0.89 to 3.69) | 0.10 |
| Hispanic adults | 2.20 (0.67 to 7.27) | 0.20 |
| 1
HR = Hazard Ratio, CI = Confidence Interval |
||
Adjusted HRs
Stratified 1 - level Cluster Sampling design (with replacement)
With (174) clusters.
subset(dsgn, race %in% c("Non-Hispanic White adults", "Non-Hispanic Black adults",
    "Hispanic adults") & RIDAGEYR >= 20 & RIDAGEYR <= 64 & heart_failure ==
    1)
Characteristic |
HR (95% CI) 1 |
p-value |
|---|---|---|
| Race/Ethnicity | ||
| Non-Hispanic White adults | — | |
| Non-Hispanic Black adults | 6.05 (1.87 to 19.6) | 0.003 |
| Hispanic adults | 0.28 (0.06 to 1.32) | 0.11 |
| Age | 1.06 (0.99 to 1.14) | 0.087 |
| Sex | ||
| Men | — | |
| Women | 2.89 (1.17 to 7.11) | 0.021 |
| Health Insurance (Yes/No) | ||
| Yes | — | |
| No | 0.82 (0.18 to 3.73) | 0.79 |
| Waist Circumference | ||
| Normal | — | |
| High | 0.61 (0.10 to 3.54) | 0.58 |
| Smoking Status | ||
| Never | — | |
| Past | 9.30 (4.32 to 20.0) | <0.001 |
| Current daily/nondaily smoker | 3.56 (1.02 to 12.4) | 0.047 |
| Hypertension | 0.58 (0.18 to 1.91) | 0.37 |
| Diabetes Mellitus | 4.15 (1.39 to 12.4) | 0.011 |
| Hyperlipidemia | 0.14 (0.06 to 0.33) | <0.001 |
| Cancer | 0.00 (0.00 to 0.00) | <0.001 |
| Stroke | 0.07 (0.02 to 0.25) | <0.001 |
| Coronary Artery Disease | 28.8 (13.2 to 62.9) | <0.001 |
| Chronic Obstructive Pulmonary Disease | 0.13 (0.05 to 0.34) | <0.001 |
| Arthritis | 0.42 (0.15 to 1.16) | 0.10 |
| Obesity | 27.8 (9.43 to 82.1) | <0.001 |
| 1
HR = Hazard Ratio, CI = Confidence Interval |
||
Kaplan-Meier Curves:
All-Cause Mortality:
Cardiac Mortality: